How do I create a map chart in Excel?
To create a map chart, select your geographic data (e.g., countries, states) and corresponding values. Go to the Insert tab, click 'Charts,' then choose 'Map' and 'Filled Map.' Excel automatically generates a visual map based on your data points, making it easy to see regional trends instantly.
What kind of geographic data does Excel map charts support?
Excel map charts primarily support standard geographic regions such as countries, states, provinces, and even some postal codes. Ensure your data is consistently formatted to ensure Excel correctly recognizes and plots the locations, providing accurate and visually appealing results.
Can I customize the colors and legends of an Excel map chart?
Yes, extensive customization options are available. After creating your map, select the chart, then use the 'Chart Elements,' 'Chart Styles,' and 'Chart Filters' options to adjust colors, legends, data labels, and chart titles. This allows for personalized visual branding and enhanced readability.
Are map charts available in all Excel versions?
No, map charts are specifically available in Microsoft Excel 365 and Excel 2019. If you're using an older version, this feature may not be accessible. Upgrading to a compatible version ensures you can utilize these dynamic data visualization tools for your projects.
How can I add data labels to my Excel map chart?
To add data labels, click on your map chart, then click the '+' icon (Chart Elements) on the right side. Check the 'Data Labels' box to display the values directly on the map regions. You can further customize their position and format from the 'More Options' menu for clarity.
Why is my Excel map chart not displaying correctly or showing blank areas?
Common issues include misspelled geographic names or unsupported region types. Double-check your data for accuracy and consistency. Ensure your internet connection is stable, as Excel uses online services to render the maps. Reviewing your data types can resolve many display problems.
Can Excel map charts be used for real-time data visualization?
While Excel map charts are excellent for visualizing static or periodically updated data, they don't natively support real-time data streams. For truly real-time updates, you would typically integrate Excel with external tools or refresh your data manually to reflect the latest information on the map.
Unlock the power of geographic data visualization with Excel's Map Charts. This essential guide for Gen Z and Millennials provides clear, actionable steps to transform raw data into stunning, interactive maps. Discover where to find this powerful feature, how to navigate its options, and master best practices for creating impactful visualizations. Whether you're tracking sales by region, analyzing demographic trends, or simply making your presentations more engaging, Excel Map Charts offer an intuitive solution. Stay ahead in 2026 by leveraging these tools to gain deeper insights from your data, making complex information easily digestible and visually appealing. Learn to tell compelling stories with your numbers, enhancing decision-making and communication.
- How do I quickly create a geographic map chart in Excel 365? - To create a map chart in Excel 365, select your geographic data like country names and corresponding values. Then, navigate to the Insert tab, choose Charts, and select the Filled Map option. Excel will automatically generate a dynamic map visualization of your data. This process is intuitive and highly visual, perfect for quick data insights.
- What kind of data is best for Excel's Map Charts feature? - Excel's Map Charts work best with clearly defined geographic data, such as country names, state or province names, and postal codes. Ensure your data is consistently formatted for accurate plotting. Each geographic entity should have a corresponding numeric value to visualize, allowing Excel to effectively represent variations across regions.
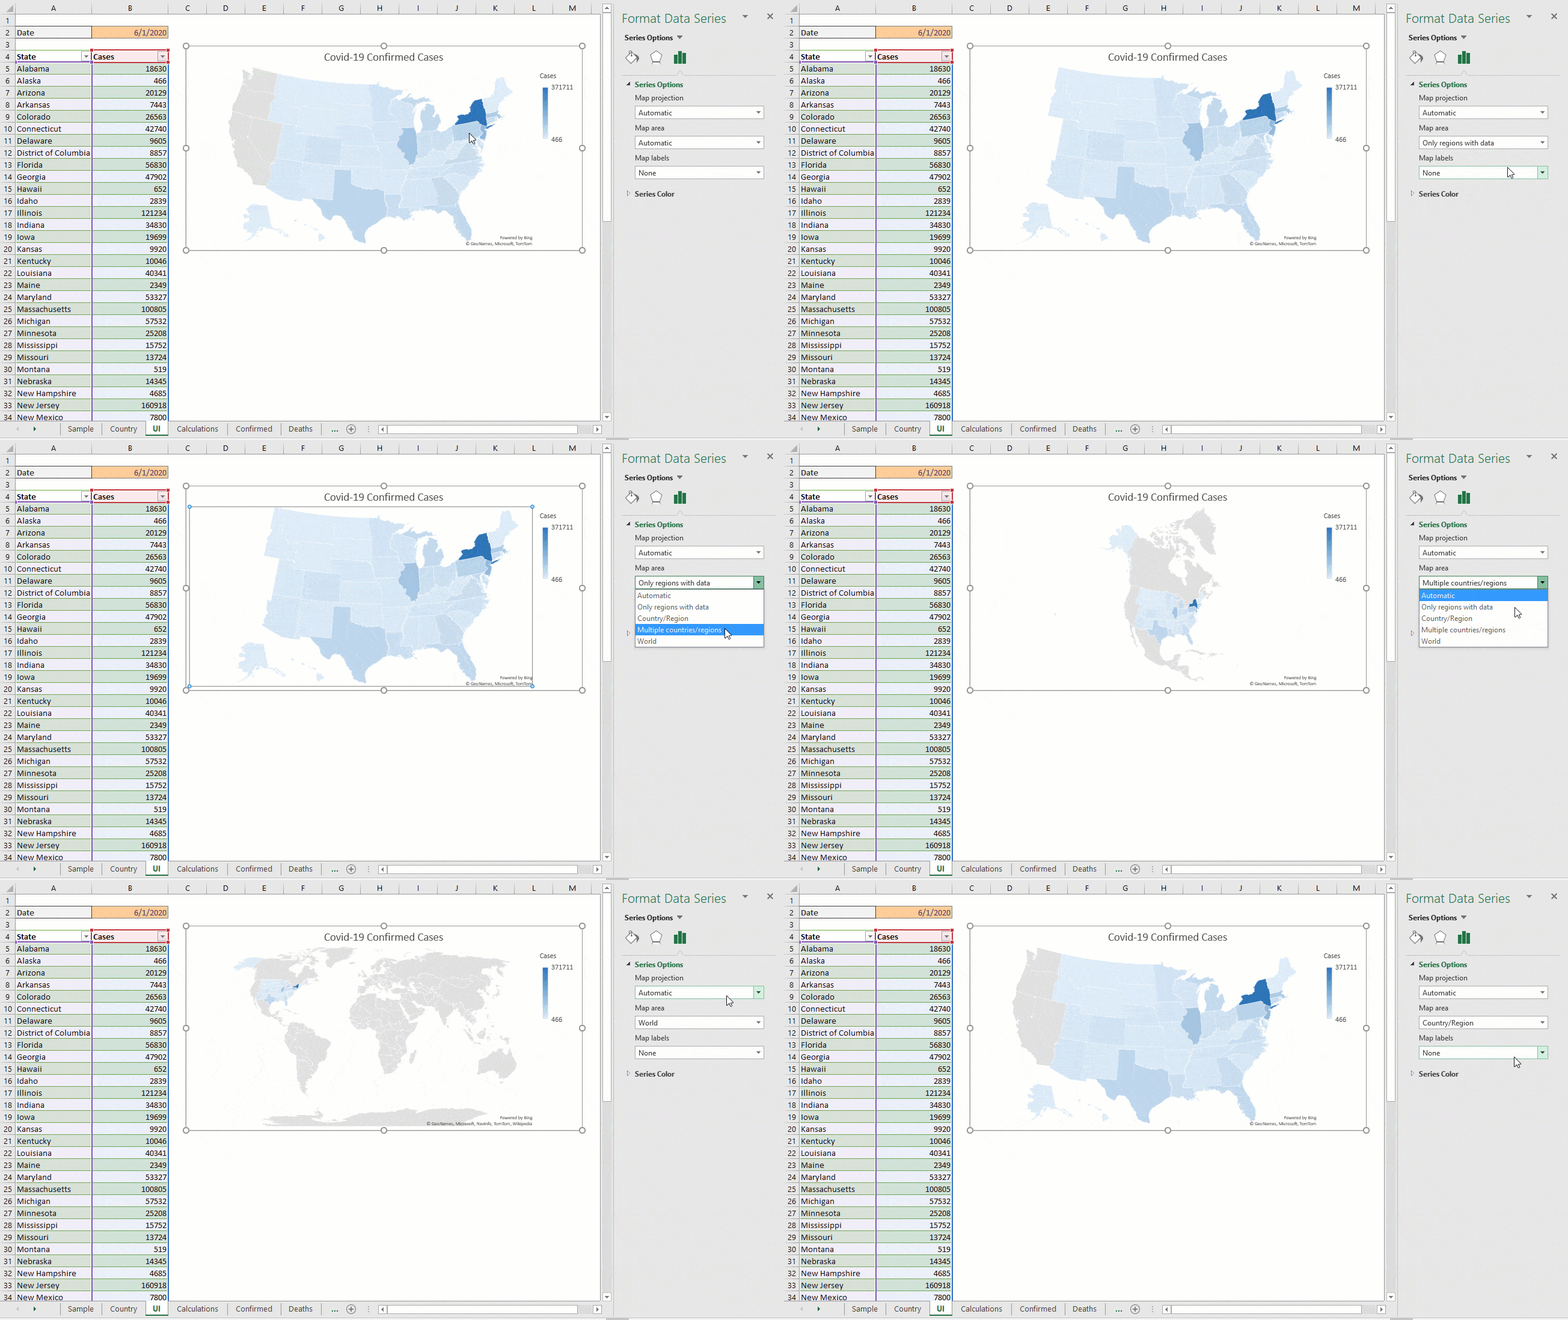
- Where can I find advanced customization options for Excel map charts? - Advanced customization for Excel map charts is available through the 'Chart Design' and 'Format' contextual tabs that appear when you select your map. You can modify colors, legends, data labels, and chart titles to enhance visual appeal and clarity. Explore the 'Format Data Series' pane for granular control over map projections and color scales.
- Is an internet connection required to use Excel Map Charts effectively? - Yes, an internet connection is typically required for Excel to fetch the geographic mapping data and render the map charts correctly. Excel uses online services to identify and plot regions accurately based on your input data. Ensure stable connectivity for the best performance and to avoid any display issues with your maps.
- Why might my Excel Map Chart show regions incorrectly or as blank? - Incorrectly displayed or blank regions in your Excel Map Chart often stem from misspelled geographic names, unsupported region types, or inconsistent data formatting. Verify that your data entries precisely match recognized geographic names. Also, confirm a stable internet connection for Excel to accurately retrieve and render the map data.
- Can I use Excel Map Charts to compare multiple data series on one map? - Excel Map Charts are primarily designed for visualizing a single data series across geographic regions at a time. While you can create multiple maps for different series, directly overlaying or comparing several series on one single map chart is not a native feature. Consider using interactive dashboards to combine multiple map views effectively.
- What are the best tips for making my Excel Map Chart visually impactful? - To make your Excel Map Chart visually impactful, choose a color scheme that effectively highlights data variations, use clear and concise titles, and ensure data labels are legible. Avoid clutter by only displaying essential information. Experiment with different map projections and zoom levels to focus on critical regions, enhancing the map's storytelling potential.
Dive into Excel's Map Charts to transform your data. Get ready to visualize geographic insights effortlessly. This quick guide cuts straight to the chase, helping you leverage powerful mapping capabilities right within your spreadsheet software.
Frequently Asked Questions
Where can I find the Map Chart feature in Excel?
You'll find the Map Chart feature within Microsoft Excel 365 and Excel 2019. It's located under the Insert tab, within the Charts group, providing a seamless way to visualize geographic data.
How do I navigate Excel's Map Chart options efficiently?
To explore Map Chart options, navigate to the Insert tab, then the Charts group. Real-time feature updates are best checked via official Microsoft Office documentation online, as new functionalities roll out frequently to enhance your mapping experience.
What are the best practices for effective Excel Map Charts?
For optimal results, ensure your geographic data is clean. Use a clear column for regions (countries, states, provinces) and another for values. Experiment with chart styles for visual impact and always label your data for clarity.
- Feature: Map Chart - Location: Insert Tab, Charts Group
- Data Type: Geography - Location: Data Tab, Data Types Group
- Customization: Chart Elements - Location: Design & Format Tabs (Contextual)
All maps focus on map chart in excel.
Effortless geographic data visualization, Interactive map creation in Excel, Data storytelling with visual maps, Key insights from regional data, Excel 365 and 2019 compatibility.


How To Create An Excel Map Chart Insert A In Geographical Microsoft Mapchartselectdata Show At Lauren Blackwell Blog Filledmap Charts Dashboard For Beginners And Advanced Maxresdefault Youtube Tutorials Mapchart Datavisualization Exceltips Oardefault SIMPLE EASIEST STEPS Make From Fastest Method 2026 Mapline Min.


How To Show Map In Excel At Deidre Denning Blog 00240 Insert A Chart Interactive Youtube Maxresdefault Create Avoid The Limitations Of Creating Maps Espatial Regional Heat Make Quick Simple Tutorial Tutorials Charts Tricks Shorts Stunning Exceltips Mapchart Philippinesmap Media Data Step By Guide Maptive Population Let S United States Example Microsoft Geographical George Hodge.


How To Create A Geographical Map Chart In Microsoft Excel Insertchartfilledmap An Insert Ms Interactive Maps Maxresdefault Step By For Beginners Charts Filledmap Europe Sheet Ultimate World RWRRKLBTD5ULW781678987075 Steps With Examples Example Country Drop Down Youtube Tips 168 Dynamic Slicers Oardefault Hiphopwery Choropleth Scatter Plot On.